Browser extensions have quietly become one of the least-governed attack surfaces in the modern enterprise stack. They run with broad permissions, update outside your normal patch cycle, and until now, most admins running Microsoft Edge for Business had to take it on faith that their ExtensionSettings policy was actually doing its job because there was nowhere to go and check. That changes this month.
What’s Actually Shipping
Microsoft is adding an Extensions monitoring page to the Edge management service, the cloud-based admin portal (edge.microsoft.com/managementservice) used to configure Edge for Business policies. The feature surfaces an aggregated, tenant-wide view of the extensions actually installed across your managed Windows browsers, plus a queue of extensions users have requested but you’ve blocked.
It’s off by default. You have to opt in twice: once at the tenant level through targeted release in the M365 admin center, and once inside the Edge management service itself, where there are two separate toggles to turn on, one to enable the monitoring dashboard generally (which also confirms Edge can send diagnostic data) and a second to specifically enable Extensions monitoring.
Rollout Schedule
| Phase | Scope | Timing |
| Public Preview | Worldwide | Rollout completing mid-June 2026 |
| General Availability | Worldwide | Begins mid-June 2026, expected complete by mid-June 2026 |
Why This Closes a Real Gap
Edge for Business has had extension governance for a while the Extensions tab on a configuration policy already lets you block all extensions by default, allow-list specific ones, control permissions, lock down install sources, and force-install or force-pin approved extensions. You can manage all of that as ExtensionSettings JSON and apply it as a Group Policy value, or push the same setting through Intune.
What’s been missing is the other half of the loop: proof. There’s been no native way to answer “what extensions are actually installed across the fleet right now” without either trusting the policy blindly or going outside Edge entirely (more on that below). Extensions monitoring gives you that inventory directly inside the same portal where the policy lives, plus a built-in workflow for handling the requests users send when something they want is blocked.
How To Enable It – Step By Step
Here’s the actual flow as it appears in the tenant today (public preview). Have targeted release turned on first, or the page won’t appear at all.
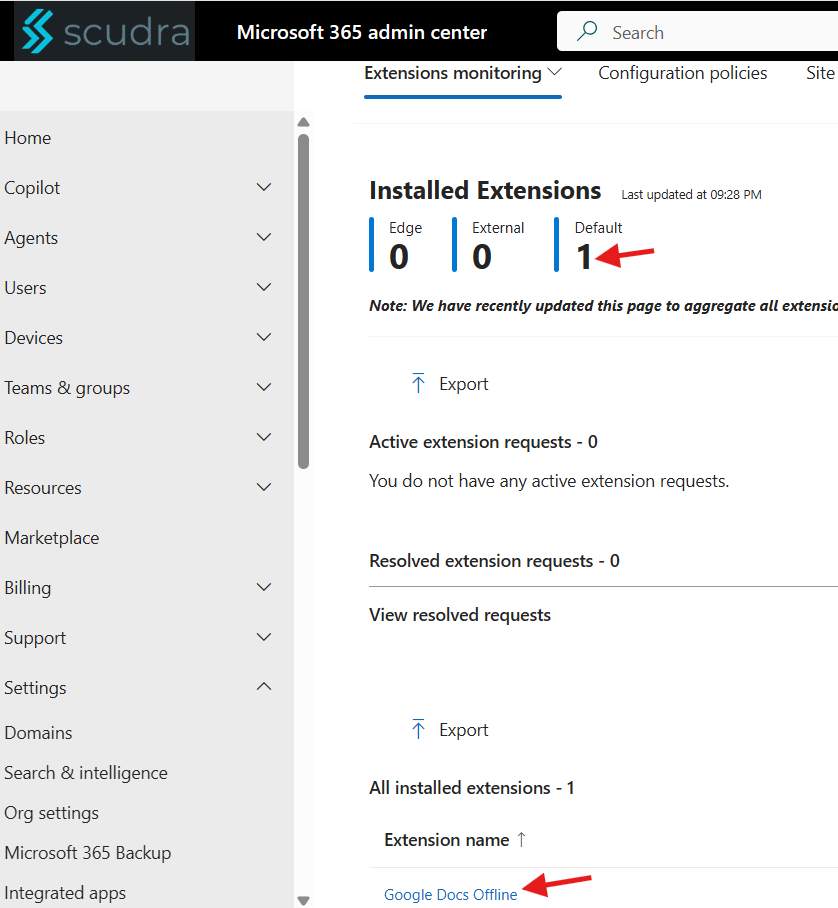
- In the Microsoft 365 admin center, go to Settings > Microsoft Edge to open the Edge management service, then navigate to the Monitoring page and select Extensions.
- If the feature is off, you’ll see an “Extensions monitoring is disabled” screen with an Enable features button. Click it.
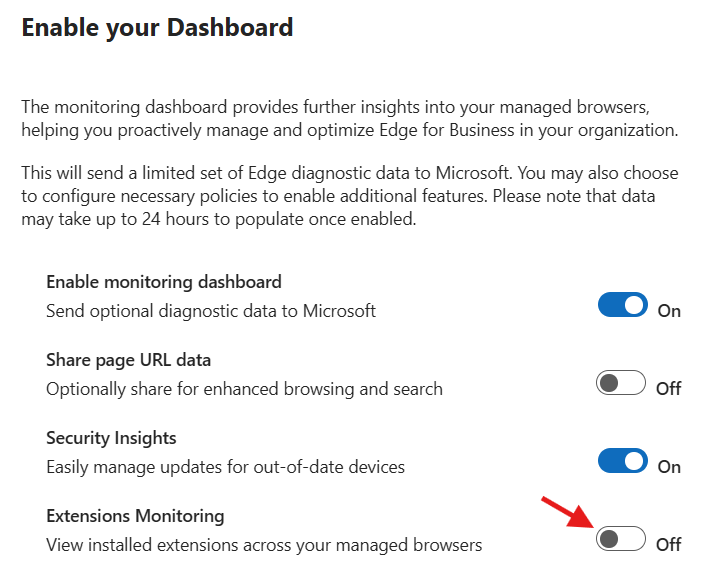
- This opens the “Enable your Dashboard” flyout. The first toggle, Enable monitoring dashboard (Send optional diagnostic data to Microsoft), starts Off, turn it On.
- Turning that on reveals three more toggles: Share page URL data, Security Insights, and Extensions Monitoring. Share page URL data and Security Insights are optional. Security Insights drives the out-of-date device update experience and may already default On.
- Flip Extensions Monitoring (View installed extensions across your managed browsers) to On. That’s the one that actually starts the extension inventory collection.
Heads up on timing
The flyout warns that data may take up to 24 hours to populate once enabled. Don’t be alarmed if the inventory and requests views are empty right after you turn it on, that’s expected, not a misconfiguration.
What Gets Created Behind The Scenes
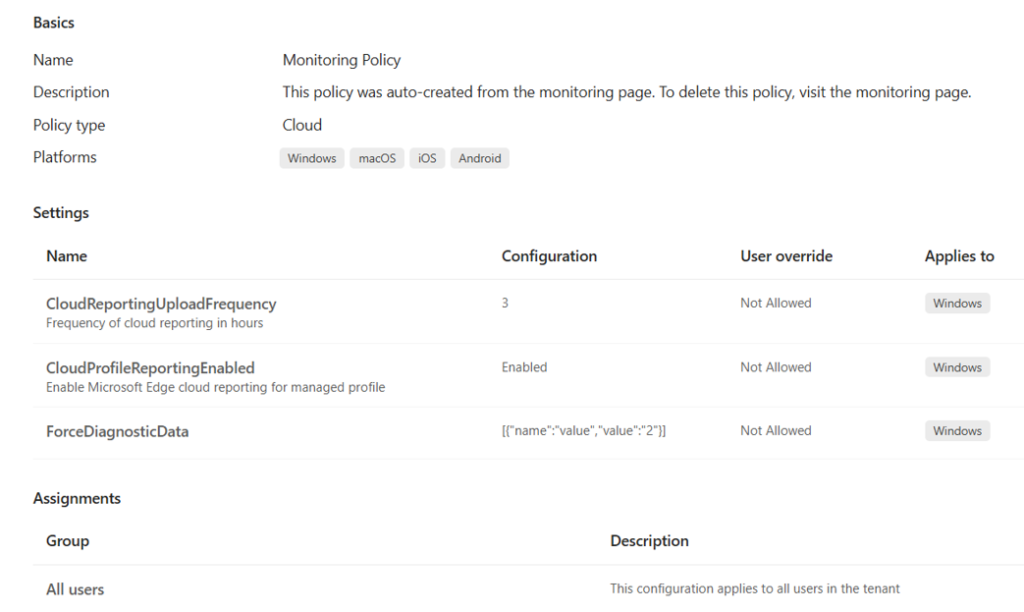
This is the part most writeups get wrong, because the official docs only mention CloudProfileReportingEnabled. In reality, enabling the dashboard auto-creates a Cloud-type configuration policy named “Monitoring Policy” (described in-portal as “auto-created from the monitoring page”), assigned to All users in the tenant. It writes three settings, not one:
| Setting | Value | User override | Applies to |
| CloudReportingUploadFrequency | 3 (frequency of cloud reporting, in hours) | Not Allowed | Windows |
| CloudProfileReportingEnabled | Enabled | Not Allowed | Windows |
| ForceDiagnosticData | [{“name”:”value”,”value”:”2″}] | Not Allowed | Windows |
Detail worth catching for multi-tenant work
The Monitoring Policy is tagged for Windows, macOS, iOS and Android at the policy level but the three reporting settings each apply to Windows only, and extension telemetry is Windows-only in practice. So the broad platform tag is misleading: don’t expect macOS/iOS/Android extension data just because those platforms show on the policy. All three settings are set to User override: Not Allowed. And because the policy targets All users, if you manage Edge config in a CSP/GDAP tenant where you scope policies tightly to specific groups, be aware this one lands tenant-wide automatically. To remove it later, you delete it from the monitoring page not by editing the policy directly.
Other behavioral details before you flip the switch
- Extensions data is Windows-only for now, nothing from macOS, Android, or iOS Edge installs, regardless of the policy’s platform tags.
- Data only comes from profiles whose identity tenant matches the tenant managing the browser, personal/consumer profile signins on a managed device won’t show up.
- If a user signs into Edge on multiple devices, you only get the report from their most recently signed-in device, not an aggregate across all of them.
- This sits alongside your existing configuration policy, it doesn’t replace it, think of it as read visibility layered on top of the enforcement you already have.
Managing What Comes In
Once data starts flowing, two things show up on the Extensions monitoring page: the installed-extension inventory, and an active requests list, every time a user hits a blocked extension and asks for access, it lands here along with where that extension currently sits in your configuration policy. From there you can:
- Click into a request to update the extension’s installation setting directly within the relevant policy
- Mark a request resolved to move it into a Resolved requests list without changing any policy
- Bulk-clear everything with Delete all requests if the queue gets out of hand
- Turn on email notifications for new requests on daily, weekly, or monthly digest, sent to whatever address you specify
The Intune Angle
This is the part worth slowing down on if you’re already managing Edge policy through Intune rather than the Edge management service portal directly. ExtensionSettings is the same underlying policy regardless of which console you use to set it. Edge management service, Group Policy, or Intune. If your organization standardized on Intune for Edge governance (which is common in CSP/GDAP multi-tenant setups, since it keeps everything in one console alongside your other device compliance work), you’ve likely already deployed it one of two ways:
| Delivery method | Where to find it | Notes |
| Settings Catalog | Devices > Windows > Configuration > Create > Settings catalog, search “Extensions” under the Microsoft Edge category | Recommended path – no ADMX import or OMA-URI required, Microsoft maintains the setting definitions |
| Administrative Templates (ADMX-backed) | Devices > Windows > Configuration > Templates > Administrative Templates | Legacy but still supported; behaves like a Group Policy ADMX import inside Intune |
| Custom OMA-URI | ./Device/Vendor/MSFT/Policy/Config/microsoft_edge~Policy~microsoft_edge~Extensions/ExtensionSettings | Only needed for settings not yet exposed in Settings Catalog. Microsoft explicitly recommends not mixing this with the other two methods for the same setting |
Practical takeaway
If you push ExtensionSettings through Intune today, the new monitoring dashboard still works, the auto-created Monitoring Policy (CloudProfileReportingEnabled, CloudReportingUploadFrequency, ForceDiagnosticData) is a separate reporting policy that doesn’t touch your ExtensionSettings enforcement. Enabling Extensions monitoring doesn’t conflict with or override an Intune-delivered ExtensionSettings policy; it just gives you visibility into whether that policy is doing what you think it’s doing. Worth knowing for multi-tenant work: the Monitoring Policy is created automatically and assigned to All users, there’s no scoping step. If your tenant hygiene depends on tightly scoped, group-targeted policies, factor in that this one lands tenant-wide the moment you enable the dashboard.
What This Doesn’t Give You (Yet)
A few limitations worth setting expectations on before you pitch this internally:
- Public preview only features and the exact toggle flow can still shift before broad GA settles in.
- No risk scoring. The dashboard tells you what’s installed and what’s been requested, not whether a given extension is dangerous. That judgment call is still on you.
- No Graph API. Unlike Edge’s IE-mode site list management, which has a documented Microsoft Graph API (/admin/edge/internetExplorerMode), there’s currently no programmatic API surface for extensions monitoring data, it’s portal-only. If you wanted to pull this into a Power BI report or a scheduled script, there’s nothing to call yet.
- Windows-only telemetry, single-device-per-identity limitation as noted above.
Complementary Visibility: Advanced Hunting
If you’re not ready to flip on tenant-wide reporting yet, or you want a second, independent data source, Defender for Endpoint already has its own browser extension inventory, the DeviceTvmBrowserExtensions table, part of the Threat and Vulnerability Management module. It requires either the Defender Vulnerability Management add-on or Defender for Endpoint Plan 2, and unlike the Edge dashboard, it gives you a risk rating per extension based on the permissions it requests.
// Browser extensions flagged High or Critical risk, across all browsers (not just Edge)
DeviceTvmBrowserExtensions
| where ExtensionRisk in ("High", "Critical")
| project DeviceName, BrowserName, ExtensionName, ExtensionVersion, ExtensionRisk, Permissions
| sort by ExtensionRisk desc
This isn’t a competing feature so much as a different lens: Defender’s table is risk-driven and cross-browser (Chrome, Edge, Firefox) but needs a TVM license; Edge management service’s new dashboard is Edge-specific, free with Edge for Business, and tied directly to your installation policy and request queue. Running both gives you risk scoring from one side and policy-request workflow from the other.
Action Checklist
| Step | Action |
| 1 | Confirm targeted release is enabled in the M365 admin center for your tenant (required to see the feature during public preview) |
| 2 | On the Extensions monitoring page, click Enable features, then in the flyout turn on Enable monitoring dashboard, then turn on Extensions Monitoring (Share page URL data / Security Insights are optional) |
| 3 | Note that the auto-created Monitoring Policy is assigned to All users tenant-wide, it won’t conflict with your existing Intune-delivered ExtensionSettings policy, but it isn’t scoped to a pilot group; plan accordingly in CSP/GDAP tenants |
| 4 | Set up email notifications for new extension requests (daily digest is usually the sane default) |
| 5 | Cross-check a sample of installed extensions against DeviceTvmBrowserExtensions in Advanced Hunting if you have TVM, to flag anything risk-rated High/Critical that’s already in use |
| 6 | Document which extensions are Allow / Block / Force in your configuration policy so the new dashboard’s data has something to be measured against |
Bottom Line
This isn’t a flashy feature, but it’s the kind of operational gap that quietly costs admins credibility when an extension-related incident happens and the honest answer to “did we know this was installed” is no. With this rolling out to GA worldwide this month, it’s a low-effort, no-additional-license way to close that gap for any tenant already running Edge for Business, whether your extension policy lives in the Edge management service directly or gets pushed there through Intune.
Official Resources
Microsoft Learn — Extensions monitoring
Microsoft Learn — Extensions management
Microsoft Learn — DeviceTvmBrowserExtensions table reference